Using the Workflow Debugger
Alfred's Workflows feature includes a debugging tool. When creating workflows that contain scripts, this additional information helps identify what's stopping the workflow from functioning correctly.
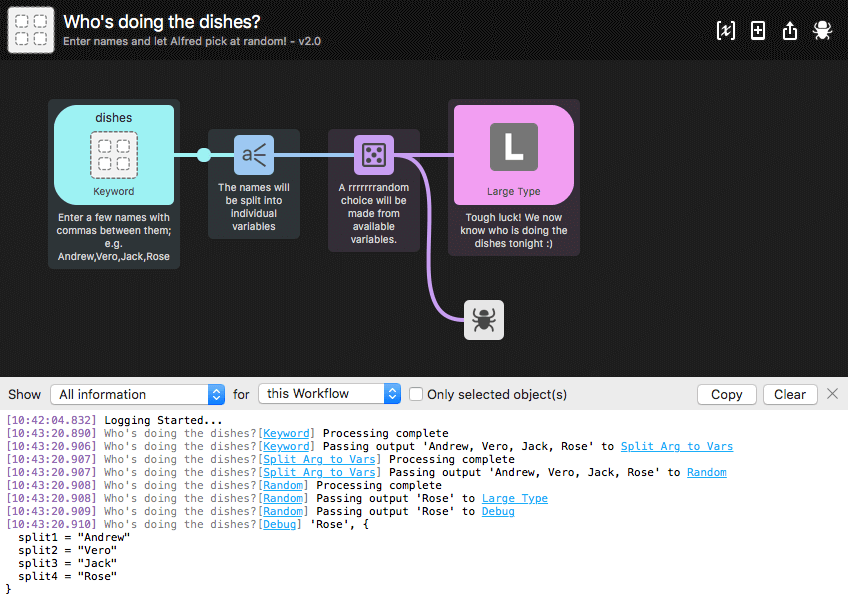
To use the Debugger, open Alfred's preferences to the correct workflow and click the bug in the top right of the workflow to display the debugger at the bottom of the screen.
The Debugger, together with the Debug Workflow Utility, can help you troubleshoot issues with your workflows' outputs.

Clicking on a hyperlinked object will highlight it in the workflow canvas, making it easy to visualise how outputs are passed from one object to the next.
Debugging Objects
Need to identify the output of a specific object? The Debug utility allows you to connect the object to the output of any other object to more precisely understand what each object is outputting.
In Alfred 4, you'll see concurrent debugging across all workflows, with filtering down to individual workflows and objects. The alfredpreferences: URL scheme used for the highlighted links means that you can copy and use these links externally.
The debugger remains enabled when switching between workflows and switching away from the Workflows tab, making it easier to keep working on your workflow without losing your train of thought.

