Debugger Utility
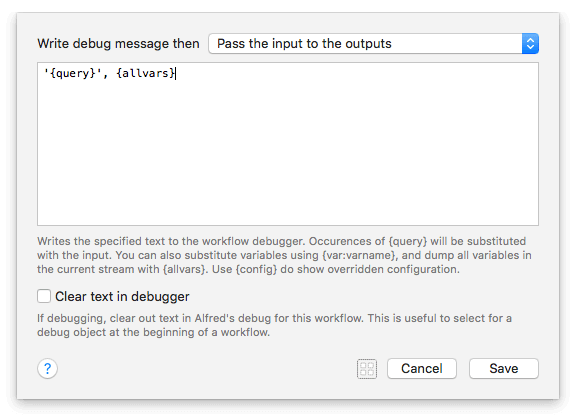
The Debug workflow object can be connected to any other object in your workflow. Together with the Debug Viewer, it can help you troubleshoot issues with your workflows' outputs.
Clicking on a hyperlinked object will highlight it in the workflow canvas, making it easy to visualise how outputs are passed from one object to the next.
Using the Debugger Utility
Add a Debug object from the Utilities objects, and attach it after the object you want to analyse.
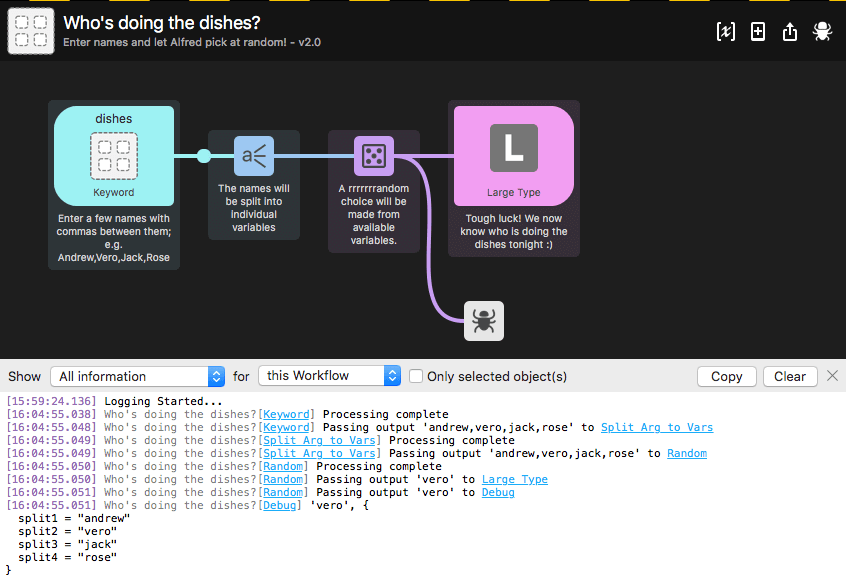
Next, click the bug icon in the top right of your workflow to toggle the debug viewer at the bottom of your workflow. By revealing this viewer, you'll now be able to see what the object connected to your debug object is outputting.
In Alfred 4, you'll see concurrent debugging across all workflows, with filtering down to individual workflows and objects. The alfredpreferences: URL scheme used for the highlighted links means that you can copy and use these links externally.
The debugger remains enabled when switching between workflows and switching away from the Workflows tab, making it easier to keep working on your workflow without losing your train of thought.
Example using the debugger
In this first example, I've attached the Debug utility to the purple Random object, to see what is output from it in the debug viewer at the bottom. I could attach it to any of the objects
You can modify the view by choosing to log Interesting Information or All Information from the dropdown, as well as either showing debug information for all objects or only for selected ones, allowing you to get more precise results if needed.