Colour Search Alfred UI Tutorial
Let's create a UI to display and filter arbitrary data.
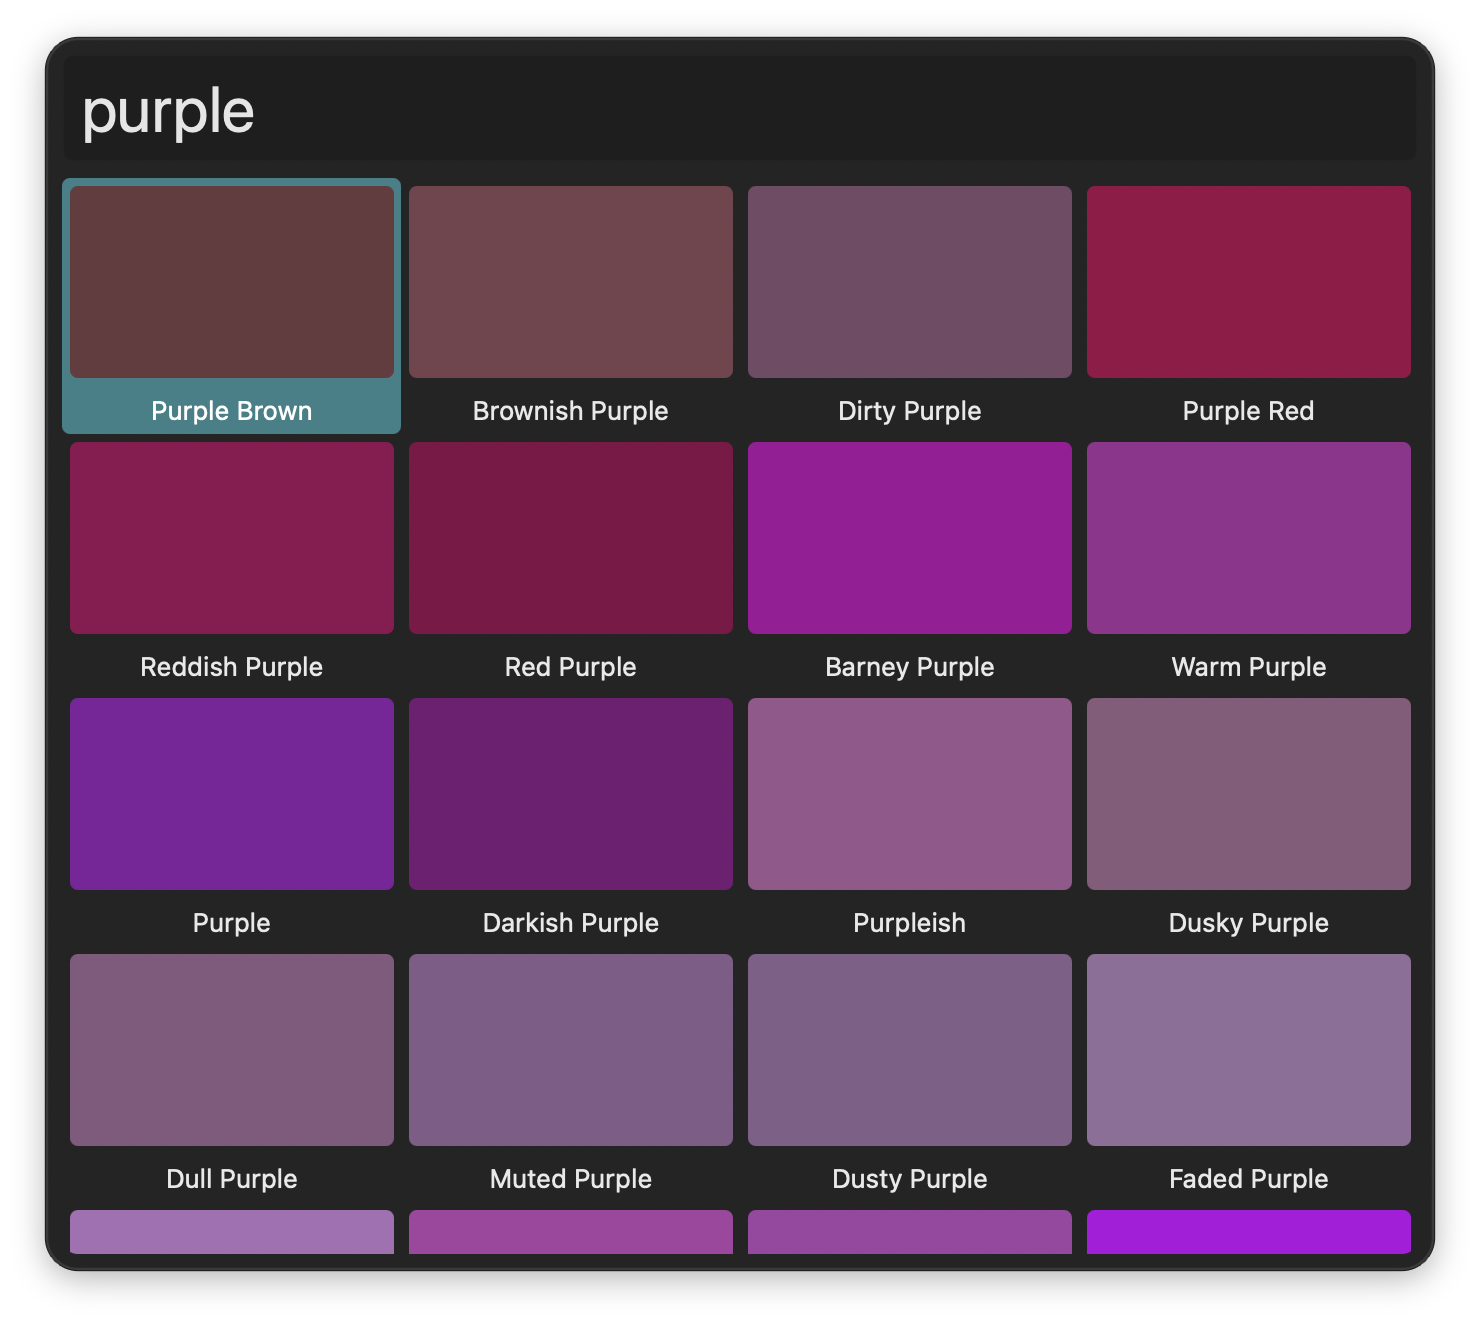
Colour Search
Find colours from the XKCD colour survey
Workflow Setup
Download the finished workflow and inspect the .alfredui. We've covered layout a lot in previous tutorials, so this time we'll focus on data.
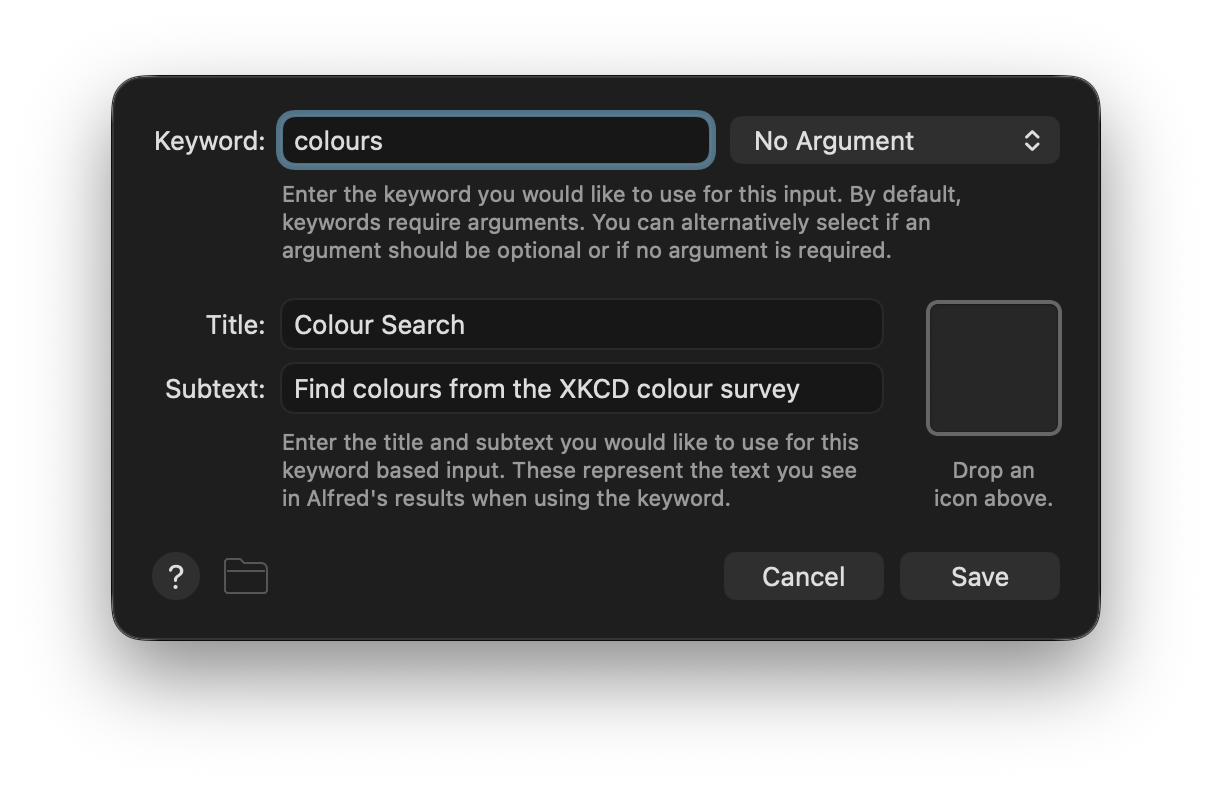
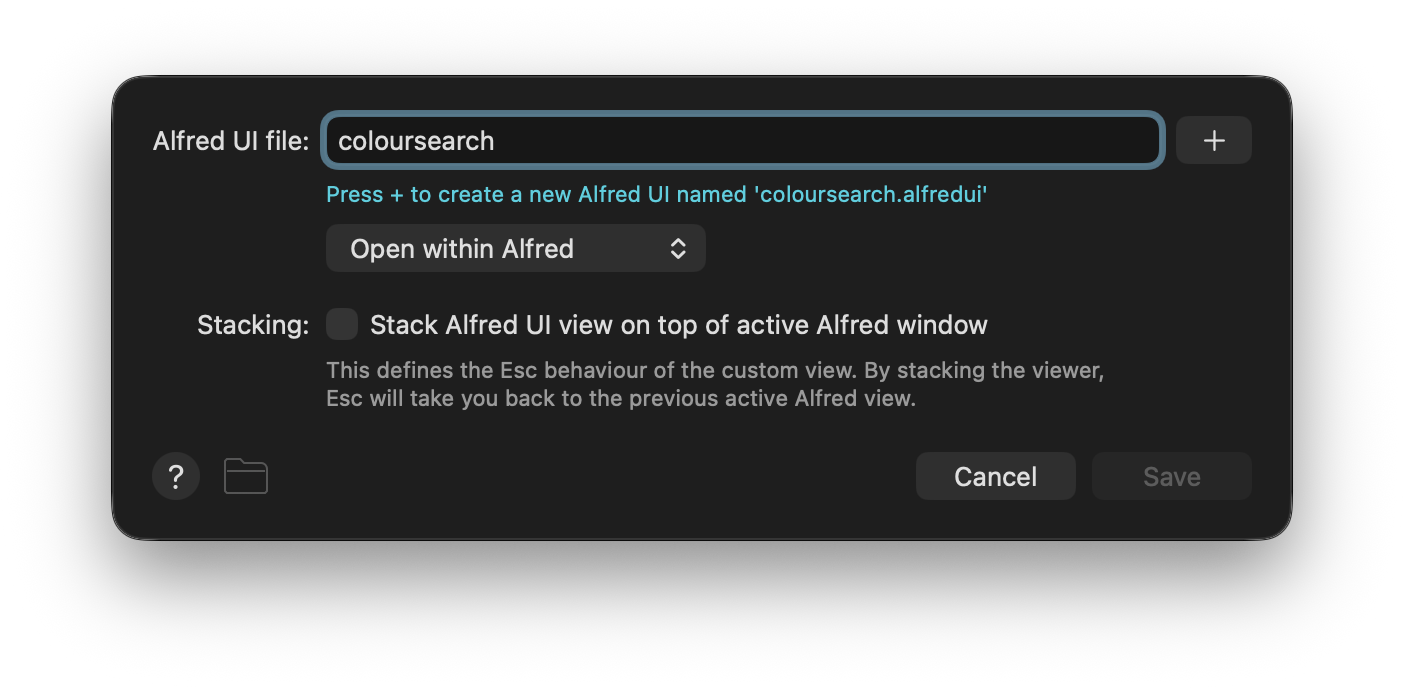
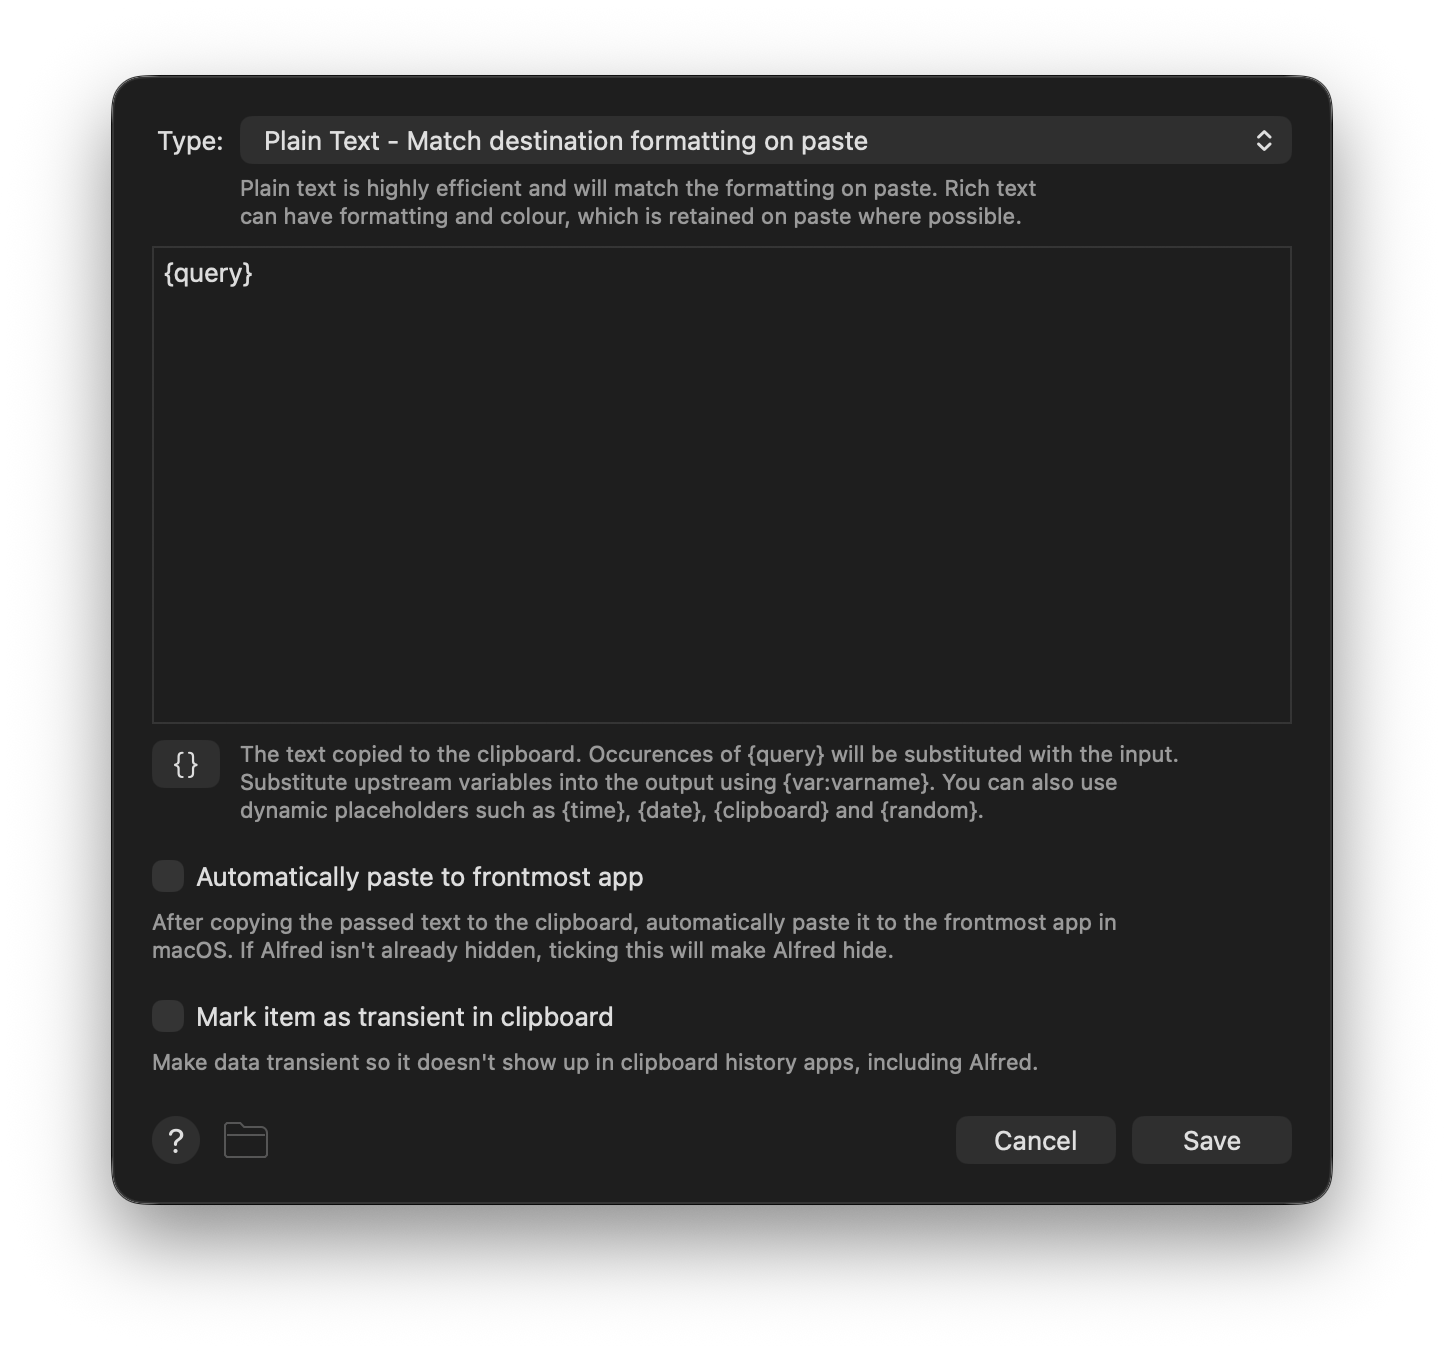
On the outside we have a Keyword Input connected to an Alfred UI object as usual, plus a Copy to Clipboard Output to show you a way to get information out. Alfred UIs are part of Alfred Worflows after all, and are thus designed to be able to connect to and from other objects.
Building the UI
NoteRefer back to previous tutorials for further detail on some concepts discussed here. Despite focusing on distinct stand-alone UIs, tutorials are designed to be followed in order.
Picking a Data Source
To learn how to populate a data view, it helps if we have some data (What?! Crazy, I know, who could've seen that coming). We wanted something which would be real and fairly simple, but with a moderately large number of entries and ideally colour gradience to break up the monotony. The XKCD Colour Survey results it is, then. Give the blog post a read if you fancy a laugh and don't mind mild profanity (it wouldn't be the internet otherwise), or just get on with the tutorial.
Laying Out the Outer View
The skeleton of our UI might feel second nature by now, you've seen it all before. We have a window with a border layout loading components with the {file:} placeholder.
ui.json
{
  "window": {
    "size": { "height": 600 },
    "padding": 8,
    "root": {
      "type": "view",
      "layout": "border",
      "spacing": 8,
      "shortcuts": [
        { "shortcut": "↑", "action": { "type": "function", "src": "coloursView", "args": "selectup" } },
        { "shortcut": "↓", "action": { "type": "function", "src": "coloursView", "args": "selectdown" } },
        { "shortcut": "←", "action": { "type": "function", "src": "coloursView", "args": "selectprevious" } },
        { "shortcut": "→", "action": { "type": "function", "src": "coloursView", "args": "selectnext" } }
      ],
      "components": [
        "{file:components/searchfield.json}",
        "{file:components/coloursview.json}"
      ]
    }
  }
}
There's also a number of global shortcuts triggering dataview functions. Look at them closely and you might already deduce what they do. We'll be loading data in a grid so the up and down arrows select a cell above or below the current one; the left and right arrows select the previous and next, which means the cell to the left and right most of the time but also wraps around to the previous or next rows when at the edges.
Arranging Cells
To display data we'll use the appropriately named dataview. You'll find the file for it in the components folder. Let's look at it in steps.
coloursview.json
"constraints": { "region": "centre" },
"id": "coloursView",
"type": "dataview",
"cols": 4,
We've covered constraints and id before, you'll recognise the latter's value from the global shortcuts in ui.json. cols defines how many columns to display. If you've ever worked with a Script Filter Input, you can think of it like a single column dataview and multiple columns a bit like a Grid View. But dataviews give you signficantly more control over the look and feel of your results because each cell can be as complex as any Alfred UI.
Next you'll notice a data and cell keys, which work in tandem. data defines what is loaded and cell specifies how it is presented.
Let's start with a look inside cell. First we have height.
coloursview.json
"height": 128,Cells are reused for performance, so defining how much space they take helps with laying them out consistently as you scroll through or filter the view.
Next we have three keys which are closely tied together. root sets the basic layout.
coloursview.json
"root": {
  "type": "view",
  "id": "cellArea",
  "layout": "stack",
  "cornerradius": 4,
  "components": [{
    "type": "view",
    "layout": "border",
    "padding": 4,
    "spacing": 8,
    "components": [
      {
        "constraints": { "region": "centre" },
        "id": "swatch",
        "type": "view",
        "layout": "stack",
        "cornerradius": 4
      },
      {
        "constraints": { "region": "bottom" },
        "id": "name",
        "type": "label",
        "textalign": "centre"
      }
    ]
  }]
}
The outer stack layout is used to provide a small area around the content which we'll colour to make it obvious which item is selected. Inside there's a border layout with a centre region (itself another stack layout) where we'll apply the swatch colour, and a label to set the name.
Every component has an id. We'll use those to manipulate every aspect of the cell, from loading data to manipulating content. Take a look at init and selected next.
coloursview.json
"init": {
  "name.colour": "labelColor",
  "cellArea.background": null
},
"selected": {
  "name.colour": "alfredSelectedResultTextColor",
  "cellArea.background": "alfredSelectedResultBackgroundColor"
},
These define modifications to happen on a cell when it is initialised and when it is selected. Note the dot syntax; it is describing the IDs and properties to be updated, namely the colour of the name label and the background of the swatch view. The values are dynamic colours which match your theme.
TipTry deleting just the
initor just theselectedkey and navigating the UI. When you remove the former, cells don't reset their state as you select a different one; when you remove the latter, navigating cells becomes invisible (but is still happening!).
Loading Data
Time to cover the data key.
coloursview.json
"data": {
  "type": "basic",
  "src": "{fileraw:resources/coloursdata.json}",
  "filter": {
    "type": "basic",
    "args": "name.text",
    "match": "{value:searchField.text}"
  }
},
The basic data provider is the default and takes a data structure which you define, mapping directly to components and properties within the cell. It is common to generate data from a script, for example when communicating with an API, but here we'll simplify by using preprepared data. Take a look inside the resources folder and you'll find a large JSON file consisting of a sigle array with multiple objects.
coloursdata.json
{ "swatch.background": "#01a049", "name.text": "Emerald" },
{ "swatch.background": "#02ab2e", "name.text": "Kelly Green" },
{ "swatch.background": "#15b01a", "name.text": "Green" },
{ "swatch.background": "#5cb200", "name.text": "Kermit Green" },
{ "swatch.background": "#51b73b", "name.text": "Leafy Green" },
Each entry has two pieces of data: a hex colour and a name. Note the dot syntax again; each entry defines property values for each cell, in order. The {fileraw:} placeholder differs from {file:} in that it does not process the file's contents, making it much faster to load. It is only one of several ways of loading data into src - you could also write the array directly into the file or set it programatically by outputting an update action from a script.
TipTry setting
srcto an array directly incoloursview.jsonand playing with the values. To get you started:"data": { "type": "basic", "src": [ { "swatch.background": "#01a049", "name.text": "Emerald" }, { "swatch.background": "#02ab2e", "name.text": "Kelly Green" }, { "swatch.background": "#15b01a", "name.text": "Green" }, { "swatch.background": "#5cb200", "name.text": "Kermit Green" }, { "swatch.background": "#51b73b", "name.text": "Leafy Green" }, ] },
Filtering Data
Let's look at using user input to filter the data. First we define the filtering strategy inside the data object.
coloursview.json
"data": {
  "type": "basic",
  "src": "{fileraw:resources/coloursdata.json}",
  "filter": {
    "type": "basic",
    "args": "name.text",
    "match": "{value:searchField.text}"
  }
},
The basic filter is the default and uses Alfred's own internal high-performance word search algorithm. It works very much like Alfred Filters Results in the Script Filter Input. args is the field to match against, in this case the text property of the name label (note how it is the same as the key used in the loaded data). match is the UI value to match against, in this case the text property of a textfield component with the searchField ID. Let's look at that next.
searchfield.json
{
  "constraints": { "region": "top" },
  "id": "searchField",
  "type": "textfield",
  "textinsets": { "vertical": 8, "horizontal": 8 },
  "font": { "size": "extralarge" },
  "focus": true,
  "focusring": false,
  "events": [
    {
      "triggers": "changed",
      "action": {
        "type": "function",
        "src": "coloursView",
        "args": "filterdata"
      }
    },
    {
      "triggers": "actioned",
      "action": {
        "type": "json",
        "src": {
          "finish": {
            "args": "{value:coloursView.selected.swatch.background}"
          }
        }
      }
    }
  ]
}
The changed event trigger sends a filterdata function to the dataview, setting off the filter on each key press.
NoteA
changedevent is fine here because all the data is local and already loaded. You should consider thetypingstoppedtrigger when you don't want the event to fire so often.
Sending Values Outside Alfred UI
There is one more thing to discuss, the actioned event trigger.
{
  "triggers": "actioned",
  "action": {
    "type": "json",
    "src": {
      "finish": {
        "args": "{value:coloursView.selected.swatch.background}"
      }
    }
  }
}
This is what happens when you ↩ on the text field. The finish JSON Action closes the UI and sends along its args value, which here inspects the dataview (whose id is coloursView) then drills down into the special selected property to grab the current cell, then goes into the swatch view and reads its background. This makes it so the hex colour value is passed to the next object in the Alfred workflow, namely the Copy to Clipboard Output.
ImportantThe event is on the textfield and not the data view, because that's where the focus remains even as you're navigating the data with the arrow keys.
And there you have! You now have fast access to the most common RGB monitor colors, as defined by several hundred thousand participants in the XKCD color name survey, right at your fingertips.